Jobs increase in Quad Cities, Illinois
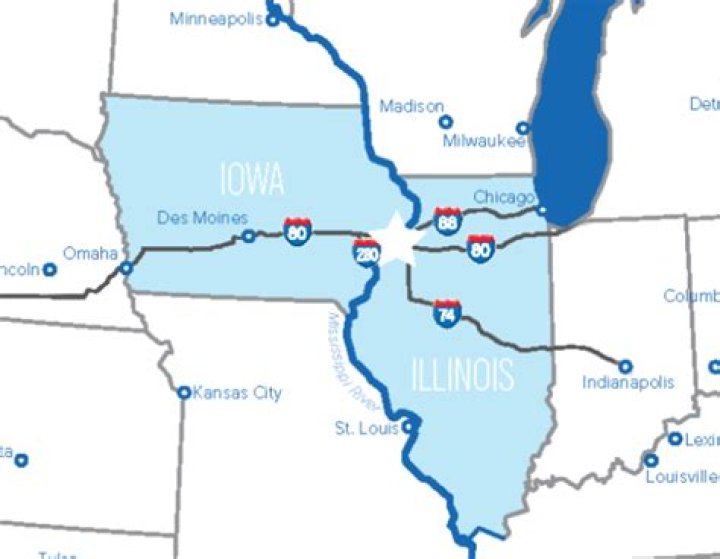
Over-the-year, total non-farm jobs increased in all 14 metropolitan areas – including the Quad Cities – for the year ending June 2023, according to data released Thursday by the U.S. Bureau of Labor Statistics (BLS) and the Illinois Department of Employment Security (DES). Over-the-year, the unemployment rate increased in 13 metropolitan areas and decreased in one.
“Today’s data again shows more than two consecutive years of job growth and expansion within industry sectors and across the state,” said Deputy Governor Andy Manar. “As more jobs are created and added to the Illinois labor market, IDES and its workforce partners across the state continue to serve as a vital resource to match job-seekers and employers.”
The metro areas which had the largest over-the-year percentage increases in total non-farm jobs were the Danville MSA (+3.3%, +900), the Peoria MSA (+2.7%, +4,600), and the Champaign-Urbana MSA (+2.6%, +2,900). Total non-farm jobs in the Chicago-Naperville-Arlington Heights Metropolitan Division were up +2.0% or +74,000. Industries that saw job growth in a majority of metro areas included: Education and Health Services and Leisure and Hospitality (twelve areas each); Government (eleven areas), Other Services (ten areas); Transportation, Warehousing and Utilities (nine areas); and Manufacturing (eight areas).
The metro areas with the largest unemployment rate increases were the Danville MSA (+1.0 point to 5.9%), the Kankakee MSA (+0.9 point to 5.7%), the Rockford MSA (+0.9 point to 6.3%) and the Lake County-Kenosha County IL-WI Metropolitan Division (+0.8 point to 4.6%). The only metro area with an unemployment rate decrease was the Chicago-Naperville-Arlington Heights Metropolitan Division (-1.0 percentage point to 4.3%).
Unemployment Rates (Not Seasonally Adjusted)
| Metropolitan Area | June 2023* | June 2022** | Over-the-Year Change |
| Bloomington | 4.3% | 3.8% | 0.5 |
| Carbondale-Marion | 4.8% | 4.4% | 0.4 |
| Champaign-Urbana | 4.7% | 4.1% | 0.6 |
| Chicago-Naperville-Arlington Heights | 4.3% | 5.3% | -1.0 |
| Danville | 5.9% | 4.9% | 1.0 |
| Davenport-Moline-Rock Island, IA-IL | 4.3% | 3.7% | 0.6 |
| Decatur | 6.3% | 5.6% | 0.7 |
| Elgin | 4.9% | 4.2% | 0.7 |
| Kankakee | 5.7% | 4.8% | 0.9 |
| Lake-Kenosha, IL-WI | 4.6% | 3.8% | 0.8 |
| Peoria | 5.0% | 4.4% | 0.6 |
| Rockford | 6.3% | 5.4% | 0.9 |
| Springfield | 4.5% | 4.0% | 0.5 |
| St. Louis (IL-Section) | 4.5% | 3.9% | 0.6 |
| Illinois Statewide | 4.5% | 4.8% | -0.3 |
| * Preliminary I ** Revised |
Total Non-farm Jobs (Not Seasonally Adjusted)
| Metropolitan Area | June | June | Over-the-Year |
| 2023* | 2022** | Change | |
| Bloomington MSA | 96,300 | 94,700 | 1,600 |
| Carbondale-Marion MSA | 56,100 | 55,600 | 500 |
| Champaign-Urbana MSA | 115,600 | 112,700 | 2,900 |
| Chicago-Naperville-Arlington Heights Metro Division | 3,849,000 | 3,775,000 | 74,000 |
| Danville MSA | 27,800 | 26,900 | 900 |
| Davenport-Moline-Rock Island MSA | 187,200 | 184,000 | 3,200 |
| Decatur MSA | 48,400 | 47,900 | 500 |
| Elgin Metro Division | 267,100 | 262,100 | 5,000 |
| Kankakee MSA | 43,300 | 43,200 | 100 |
| Lake-County-Kenosha County Metro Division | 430,100 | 422,000 | 8,100 |
| Peoria MSA | 174,700 | 170,100 | 4,600 |
| Rockford MSA | 147,400 | 146,900 | 500 |
| Springfield MSA | 109,800 | 108,400 | 1,400 |
| Illinois Section of St. Louis MSA | 239,500 | 239,200 | 300 |
| Illinois Statewide | 6,190,600 | 6,061,400 | 129,200 |
| *Preliminary | **Revised |
Not Seasonally Adjusted Unemployment Rates
(percent) for Local Counties and Areas
| Labor Market Area | Jun 2023 | Jun 2022 | Over the Year Change | ||
| Davenport-Moline-Rock Island, IA-IL MSA | |||||
| Henry County | 5.0 % | 4.1 % | 0.9 | ||
| Mercer County | 4.4 % | 3.5 % | 0.9 | ||
| Rock Island County | 5.0 % | 4.0 % | 1.0 | ||
| Cities | |||||
| Galesburg City | 6.2 % | 5.5 % | 0.7 | ||
| Moline City | 4.8 % | 4.0 % | 0.8 | ||
| Rock Island City | 5.3 % | 4.3 % | 1.0 | ||
| Counties | |||||
| Bureau County | 5.6 % | 4.0 % | 1.6 | ||
| Fulton County | 5.3 % | 4.6 % | 0.7 | ||
| Henderson County | 3.9 % | 3.8 % | 0.1 | ||
| Knox County | 5.6 % | 4.9 % | 0.7 | ||
| Stark County | 5.2 % | 4.1 % | 1.1 | ||
| Warren County | 4.5 % | 4.1 % | 0.4 | ||
| Whiteside County | 4.8 % | 4.0 % | 0.8 |
Davenport-Moline-Rock Island, IA-IL MSA
The not seasonally adjusted unemployment rate increased to 4.3 percent in June 2023 from 3.7 percent in June 2022.
Total non-farm employment increased +3,200 compared to June 2022.
Leisure-Hospitality (+2,000) and Educational-Health Services (+800) had the largest payroll gains over the year. The Professional-Business Services (-300), Retail Trade (-300), and Information (-100) sectors recorded employment declines over the year.
The unemployment rate identifies those who are out of work and seeking employment. A person who exhausts benefits, or is ineligible, still will be reflected in the unemployment rate if they actively seek work.
Note: Monthly 2022 unemployment rates and total non-farm jobs for Illinois metro areas were revised in February and March 2023, as required by the U.S. BLS. Comments and tables distributed for prior metro area news releases should be discarded as any records or historical analysis previously cited may no longer be valid. The official monthly unemployment rate series for metro areas, counties and most cities begins in 1990. The official monthly non-farm jobs series for metro areas begins in 1990 and for non-metropolitan counties it begins in 1999.
Disclaimer: The data contained in the metro area employment numbers press releases are not seasonally adjusted, and therefore are subject to seasonal fluctuations due to factors such as changes in weather, harvests, major holidays, and school schedules. Current monthly metro data should be compared to the same month from prior years (January 2023 data compared to January 2022 data) as data for these months have similar seasonal patterns. Comparisons should not be made to data for the immediate previous month or other previous non-matching months, as any changes in the data within these time periods may be the result of seasonal fluctuations and not economic factors.